5.3 Primary Productivity
Primary productivity (PP) is defined as the rate of energy or mass storage in organic matter of plants per unit surface area of the earth. In terrestrial ecosystems PP is conventionally divided into two components: 1) gross primary productivity (GPP) is the amount of organic material synthesized by plants per unit ground area per unit time, and 2) net primary productivity (NPP) is the amount of this organic material that remains after respiratory consumption of organic matter by the plants (Ra). All heterotrophic organisms rely on NPP for their food requirements. In forests, Clark et al. (2001) emphasized that a working definition of NPP for actual measurements must be adapted from the formal definition (above) because direct measurements of GPP and Ra are not possible and accounting for a variety of other losses of organic material from plant tissues during a measurement interval also can be challenging. In theory NPP could be quantified as:
\[ NPP = ∆B + M + H + L + V \tag{5.1}\]
where ∆B is net change in biomass and M, H, L, and V are losses of organic matter from plant tissues owing to mortality, herbivory, leaching and volatilization, respectively. The reason that we must add loss terms like mortality to ∆B when calculating forest NPP is illustrated by the case where ∆B=0: if live biomass doesn’t change over a time interval during which losses of organic material are occurring, then the plants must have added new organic material to replace those losses. Thus, the loss terms would be equal to this new production. To estimate forest NPP at Hubbard Brook we quantify changes in live tree biomass using the allometric equations (described above) and we estimate the principal loss terms, tree mortality and mortality of ephemeral tissues (leaves and fine roots). Some of the other loss terms in Equation 5.1 also have been measured at Hubbard Brook. Although H, L and V usually comprise a relatively small proportion of aboveground NPP (ANPP), herbivory can be substantial during rare irruptions of defoliating insects. For example, during the peak year of a 3-yr irruption of a defoliating caterpillar (Heterocampa guttivita Walker) about 44% of leaf tissue was consumed in the hardwood forest at HBEF, with local patches of 100% defoliation ]Holmes & Sturges (1975)]. Finally, loss terms for belowground NPP (BNPP) are notoriously difficult to measure and can comprise a substantial portion of NPP that is particularly sensitive to environmental changes, climate, atmospheric CO2 and soil fertility.
| Biomass Components | g/m² (1997) |
|---|---|
| Foliage | 402 |
| Branch | 5436 |
| Bark | 1220 |
| Wood | 11932 |
| Total aboveground biomass | 18990 (248) |
| Root crown | 1580 |
| Lateral woody roots | 2920 |
| Fine roots (< 1 mm) | 522 |
| Total belowground biomass | 5022 (638) |
| Total plant biomass | 24012 |
| - | - |
| Production Components | g/m²·yr (1997) |
| Aboveground annual tissues | 342 |
| Aboveground perennial tissues | 366 |
| Total ANPP | 708 (62) |
| Fine roots | 182 |
| Coarse roots | 76 |
| Rhizosphere flux | 160 |
| Total BNPP | 418 |
| Total NPP | 1126 |
The first estimates of ANPP of the Hubbard Brook forest were calculated in the 1960s by Whittaker et al. (1974). At that time the forest on W6 was about 50 yrs old and ANPP was estimated at 924 g/m2-yr. Since that time ANPP has declined considerably; Fahey et al. (2005) estimated ANPP of the same forest at age ca. 90 yrs to be 708 g/m2-yr (Table 5.1). Roughly half of this total was associated with increment of woody tissue and half with replacement of ephemeral tissue (mostly foliage). The ANPP of the northern hardwood forest at Hubbard Brook is similar to a variety of other mature Acer-dominated forests worldwide (Table 5.2).
| Location | Ref. d/ | ANPP (g/m²·yr) | FPE a/ (LAI-basis) | FPE b/ (Mass-basis) | Wood PE c/ |
|---|---|---|---|---|---|
| HBEF, NH age = 45 yr | 1 | 924 | 147 | 2.28 | na |
| HBEF, NH age = 85 yr | 2 | 708 | 112 | 1.76 | 0.91 |
| Indiana mesic slope | 3 | 678 | 161 | 2.19 | 1.28 |
| Indiana bottomland | 3 | 639 | 141 | 2.06 | 1.04 |
| Wisconsin | 4 | 755 | 137 | 2.02 | 1.02 |
| Wisconsin sandy outwash | 5 | 480 | 161 | na | na |
| Wisconsin ground moraine | 5 | 920 | 133 | na | na |
| Himalayas, India | 6 | 990 | 193 | 1.80 | 0.80 |
| Upstate New York | 7 | 772 | 119 | 2.38 | 1.23 |
Belowground production (BNPP) includes the growth of perennial woody roots, the replacement of ephemeral fine roots as well as organic matter allocated to mycorrhizal fungi and other rhizosphere fluxes (e.g. root exudation). Direct observations of fine roots at Hubbard Brook using minirhizotrons indicate that most of the smallest first-and second-order roots have lifespans of about one year while higher order (order 3-4) roots live for several years (Tierney & Fahey, 2001). On the basis of these observations fine root (< 1mm) production has been estimated at 182 g/m2-yr, considerably lower than the production of aboveground ephemeral tissues (342 g/m2 yr; Table 2). However, total rhizosphere C flux has been estimated to be as high as 160 g/m2-yr (Fahey et al., 2005) so that BNPP may comprise as much as 37% of total forest NPP Table 5.2.
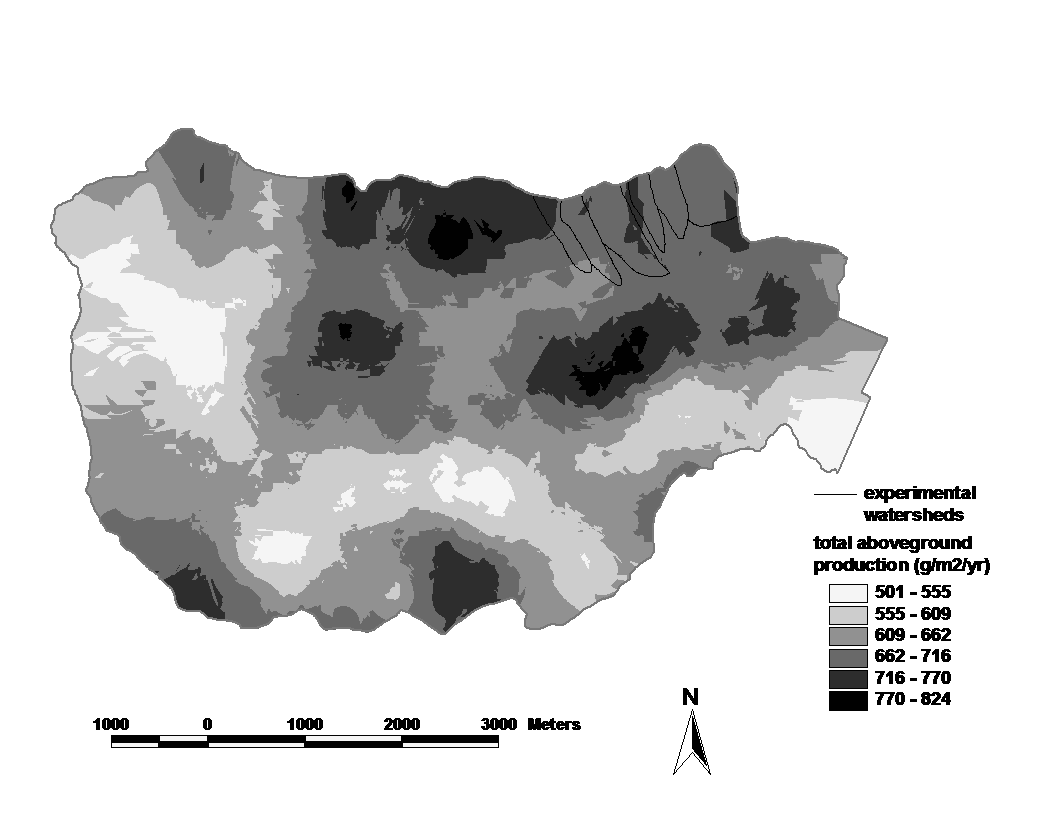
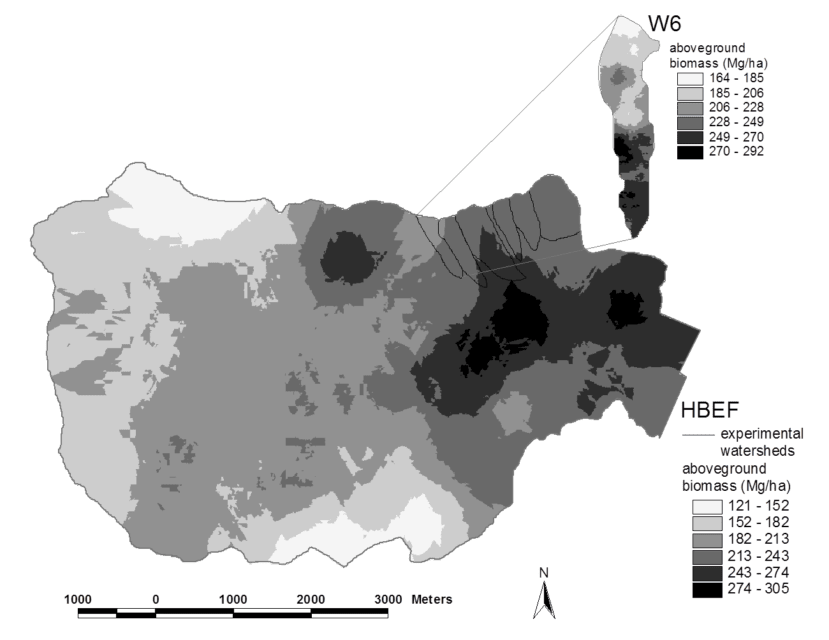
The spatial pattern of ANPP of the Hubbard Brook forest generally reflects that of biomass (compare Figure 5.2 vs. Figure 5.4). For example, 42% of the variation in woody biomass production is explained by aboveground biomass across the 370 plots represented in Figure 5.2 and Figure 5.4. The most notable decoupling between biomass and productivity is for fir-birch-spruce dominated stands at the upper elevations, where the production:biomass ratio is notably higher than elsewhere in the HB valley. The temporal pattern of NPP following large-scale disturbance follows the usual pattern of increase to a peak value after a few decades, followed by decline at greater ages. Such an age-related decline in NPP appears to be virtually universal in all forests (Ryan et al., 1997) and has been attributed to a wide range of causes. These temporal and spatial patterns beg the basic question: what limits NPP in the Hubbard Brook forest?
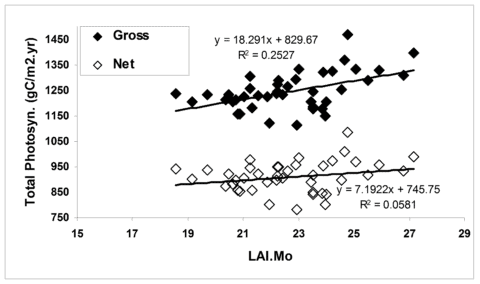
In general, forest NPP is limited by a variety of environmental conditions (e.g., temperature) and resources. In the cold temperate climate of the Northeast the short growing season during which temperatures are suitable for plant growth (i.e., the frost-free season averages 145 d; Bailey et al. 2003) is a fundamental constraint on NPP. Temperature limitations contribute to both temporal and spatial variation in NPP at Hubbard Brook. For example, the time interval between leaf out and senescence for the broadleaf deciduous trees varies by about 30 d across years at HBEF (ca. 125-155 d; (Bailey et al., 2003)), and the range of this index of growing season length across elevation (480-820 m) at Hubbard Brook is about 21 days. According to the simulation model PnET about 25% of annual variation in GPP can be explained by growing season length; however, plant respiration also is greater in years with long, warm seasons, so that the effect on NPP is much lower (e.g., only 6% of annual in net photosynthesis is explained by growing season length; Figure 5.5).
Another atmospheric condition that limits forest NPP is atmospheric CO2 concentration as demonstrated in free-air CO2 enrichment (FACE) studies in several forests (Norby et al., 2005). Although FACE experiments have not been conducted at HBEF, we have used the PnET model to evaluate possible effects of rising CO2 on NPP, independent of climate change effects. One key effect of rising atmospheric CO2 concentration on forest physiology is to allow greater stomatal control over water loss. Water-use efficiency (WUE) is defined as the ratio of plant photosynthesis per unit water loss by transpiration. Recent measurements indicate that the WUE of northeastern U.S. forests has risen steadily with atmospheric CO2 over the past two decades (Keenan et al., 2013), probably explaining the unexpected observation that declining actual evapotranspiration from the HB watersheds has accompanied rising temperatures (see Climate Change chapter).
The water-use efficiency result emphasizes that soil resource availability serves as an important constraint on forest NPP. Although precipitation is moderately high at HBEF and evenly distributed through the year, soil moisture deficits and drought stress occur occasionally. The dominant tree species are drought avoiders that close their stomata at relatively high soil water potential, thereby reducing potential damage but restricting photosynthetic C gain (Federer, 1977). Notably, regional climate warming, which in the absence of CO~ 2~-induced increases in WUE would promote higher water loss by the trees, has been accompanied by increasing annual precipitation (see Climate Change chapter).
The role of soil fertility in limiting NPP of northern hardwood forests has received considerable study over the years. Based on a recent meta-analysis of forest fertilization studies, Vadeboncoeur (2010) concluded that NPP of most young northern hardwood forests (e.g. < 30 yr) responded to the addition of N, P, K or Ca or various combinations, with primary limitation by N being most common. Evidence for nutrient limitation of NPP in mature forests was mixed. Recent results from an ongoing N x P nutrient amendment experiment in and around HBEF suggest that P limitation may be widespread in mature northern hardwood forests.
The effects of natural variation in soil nutrient availability on biomass accumulation and NPP of the Hubbard Brook forest have been modified by inputs of pollutants derived from human activity: acid precipitation and nitrogen deposition. Although direct evidence that N deposition has altered NPP of the mature forest is scant, reduction of NPP owing to depletion of soil base cations by acid deposition has been shown conclusively in the Ca remediation experiment on W1 at HBEF (Battles et al., 2014). As noted earlier, the unexpected plateau in forest biomass on W6 is explained in part by this effect. Specifically, soil Ca depletion has limited biomass accumulation primarily by causing decline of the dominant species, sugar maple, which is particularly sensitive to low soil Ca availability (Long et al., 2009). Crown deterioration and reduced LAI of sugar maple, attributed to soil Ca depletion, has contributed to the relatively low ANPP and biomass accumulation on W6 (Battles et al., 2014). In addition to reduced net photosynthesis owing to LAI loss, higher costs of wound repair and plant defense accompany the impaired Ca nutrition of sugar maple in the reference forest (Halman et al., 2013; Huggett et al., 2007). As detailed by Tominaga et al. (2010), recovery of soil base cation status is expected to be delayed in the immediate future because of the high magnitude of 20th century losses and continuing acid deposition (albeit at lower levels).
An interesting case study of the development of forest biomass and NPP following large-scale disturbance in northern hardwoods is provided by the deforestation study on W2. Reiners et al. (2012) hypothesized that the extreme disturbance of the deforestation treatment on W2 (see W2 Experimental Summary) would exceed the capacity for forest ecosystem resilience. In particular, the treatment resulted in loss of 28% of the ecosystem stock of total N (as well as smaller proportions of base cations); eliminated vegetative sprouting and advance regeneration as sources of forest regeneration; and greatly reduced the abundance of fast-growing pin cherry. Surprisingly, despite an initial lag in biomass accumulation and net primary productivity, the forest on W2 followed a trajectory similar to (though on the low end) of comparable sites that had been harvested by conventional methods (Figure 5.6).
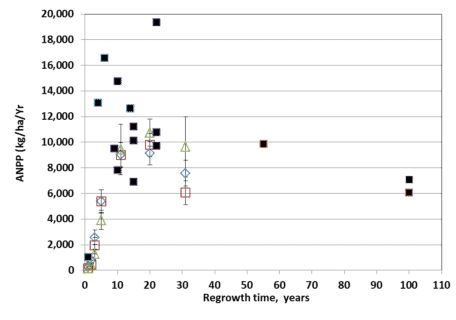
The slowest growth and biomass accumulation were observed in the upper elevation zone of the watershed where soils are thinner and less fertile (Johnson et al., 2000). These observations illustrate that northern hardwoods forests on moderately fertile soils exhibit strong resilience of productivity. The mechanisms contributing to this high resilience deserve further study but may include biologically-enhanced weathering of primary minerals (Blum et al., 2002), biological nitrogen fixation (B. T. Bormann et al., 1993) and enhanced mineralization of relatively stable soil organic matter.